
 Early last summer I was faced with a problem: As we completed a set of pre-planned and conceptually regular animation shots, our original approach to handing out tasks to artists started to resemble a research project: Delve into the files and preview, identify a ‘high priority’ item, then break it down to bite-sized tasks that could be reasonably executed by one person.
But each of these bite-sized tasks depend on one another; so the assignment often fell into order-of-operation problems – before you can rig something you need to model it, and before you light something you need to have it textured, etc. Since multiple assets link into multiple shots, and often times you need to do the same ‘type’ of task on one shot, this gets really complex to figure out- and once you’ve done it once, it’s good to be able to store those relationships in a logical way for future reference.
Helga
 Helga, our web based production tool, has a good attempt to fix this. But it is hard-coded to a specific workflow, and tends to isolate individual shots and assets so they don’t reflect their interdependence. Each shot and asset has a task tree that looks like this:
Spreadsheets
 So the next step is using spreadsheets. This is what Caldera – the previous drome project – used to do, essentially supplementing Helga with google docs. We did quite a bit of that too, often using libreoffice to make spreadsheets, and sharing them using google docs – in the future we’d like to use an opensource document collaboration platform, the likes of which collabra and libreoffice are implementing as we speak!
Graphs
The problem with spreadsheets: Everything is on a neat grid layout. That makes it easy to enter and read information, but it actually hides the structure of the data underneath. Our data consists of tasks that depend on each other in a specific order, in a kind of network that has a direction to the links. In computer science, there’s an obvious data structure to use for this: It’s called a DAG, short for Directed Acyclical Graph . Basically a network of nodes ( a graph) where each link has a direction (from node, to node) and you cannot have a cycle – either directly or indirectly, you can’t have an infinite loop of nodes (imagine if rendering depended on animation, but animation depended on rendering – you’d be stuck in a loop and could never finish the project! ). Any proper representation of our task list should reside in such a graph, fitting the data to the data representation: 
Blender!
 So, as luck would have it, Blender has a programmable DAG editor – the node editor. You’ve probably seen it in screenshots, or used it yourself, to make shaders in cycles, materials and textures for blender internal renderer, or to composite images and renders. In addition to these ‘normal’ uses of the node editor, there is a hidden feature: Blender allows you to create entirely new node network types and node types in python. This has been used to make excellent addons, such as sverchok for procedural modelling, and animation nodes for procedural animation; It might become the basis of all rigging, modelling and animation in future future versions of Blender.
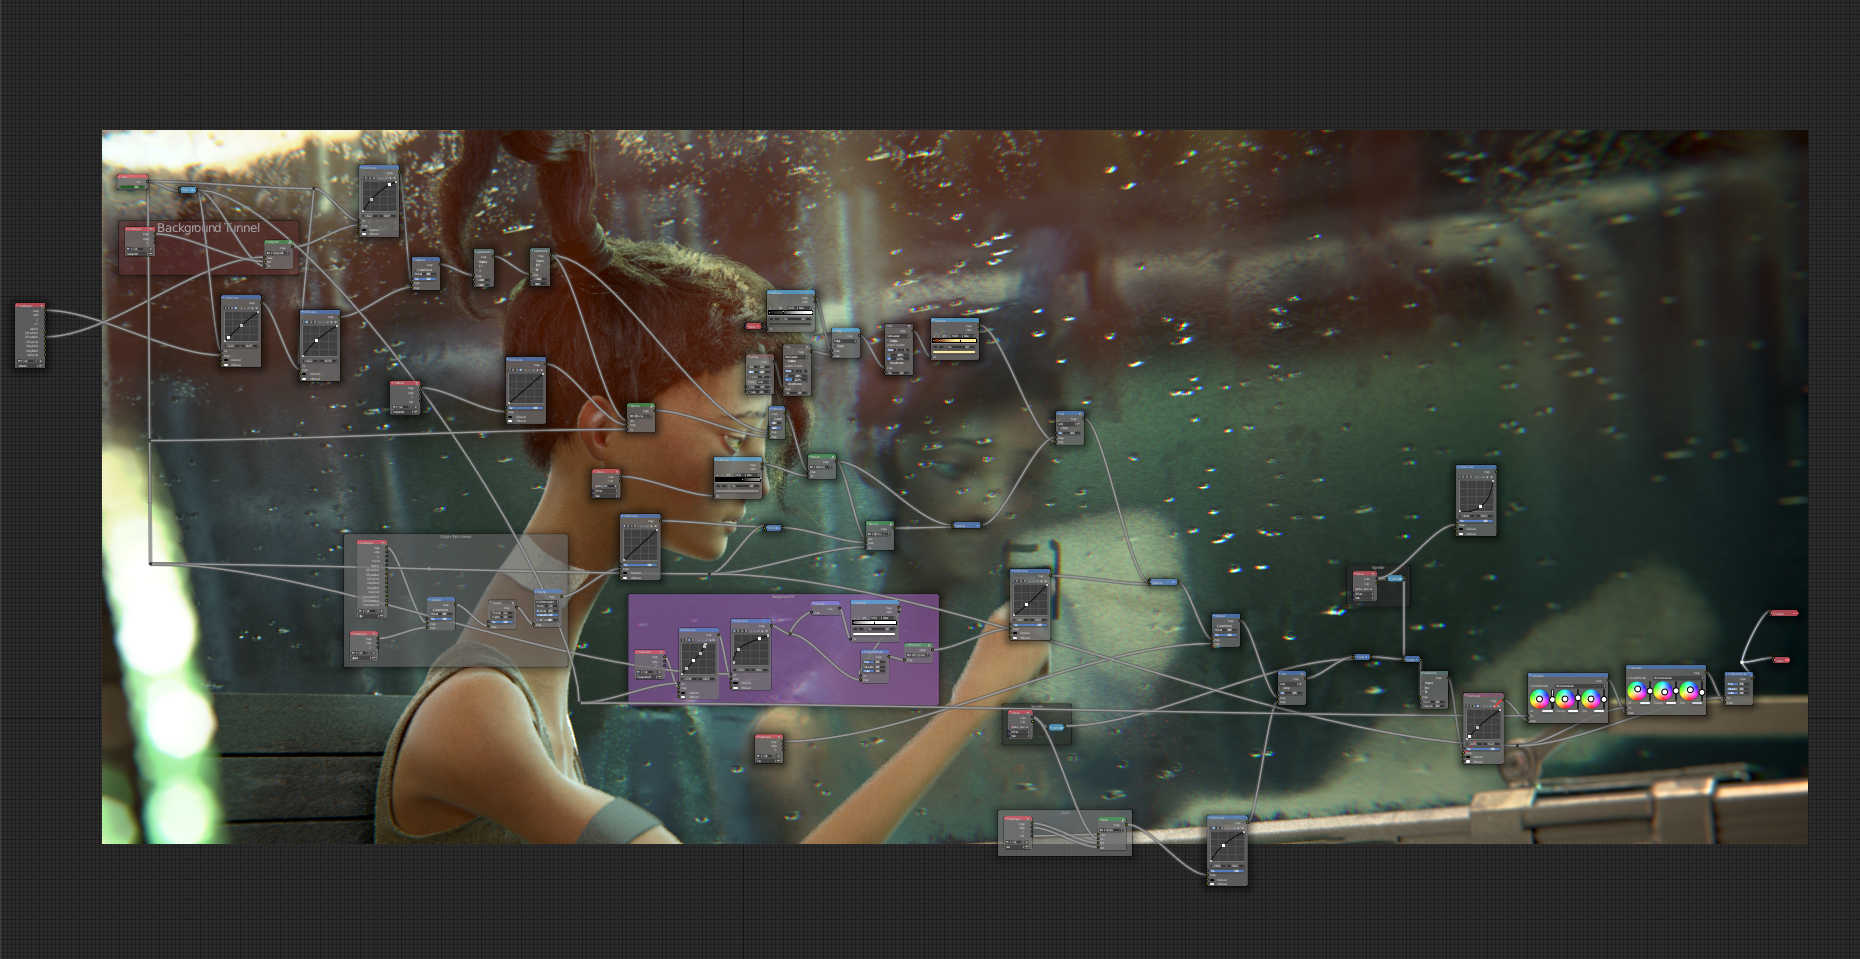
Finally, OrgNodes
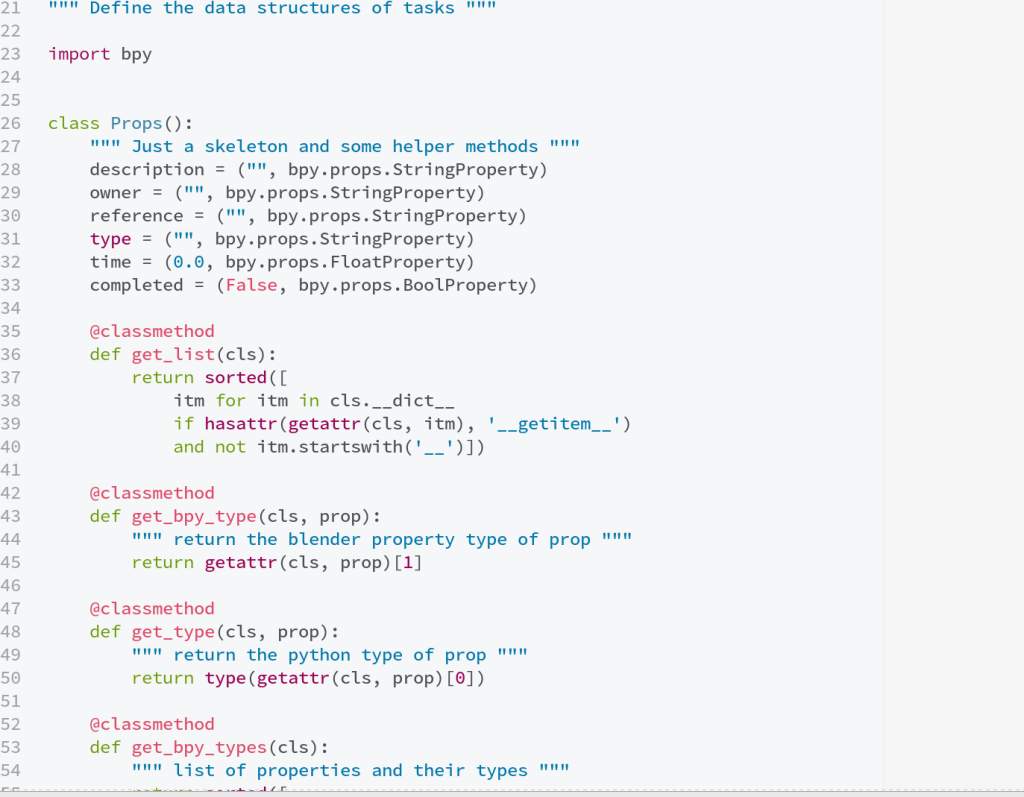
 But for our needs, it’s a convenient way of organizing the project! By creating a new node tree type in python – dependency nodes, and a new node type – a task node, we can give each task some properties and some dependencies, such as:
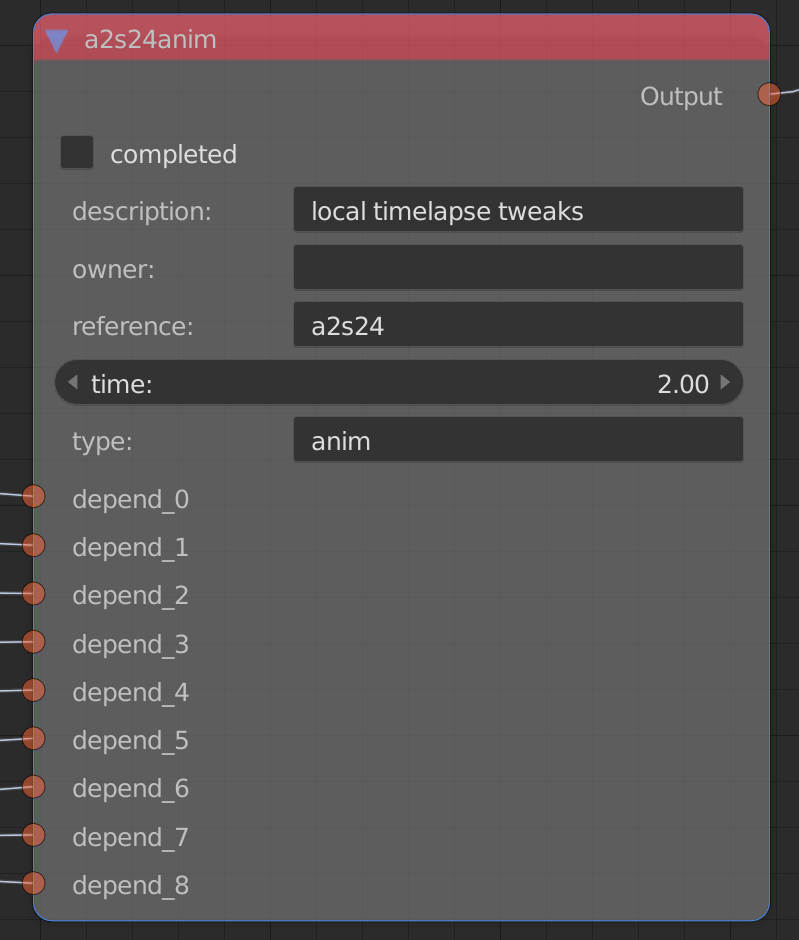
- owner – the name of the artist or coder working on the task
- time – estimated time needed to complete the task in person-days
- type – type of task: is it animation? rendering? texturing? etc.
- reference – what shot or asset is the primary reference for the task (refers to shots and assets in the helga asset list)
- Completion – Is it done or not?
- Dependencies – These are links to other, similar tasks that much be completed before this one; other tasks might have this one as dependency in a similar fashion.
Getting Data In and Out
The primary way of data entry is right in the node editor: Use Shift-A, or the handy panel on the left to create new nodes. Copy, paste, and duplication all work, as does the usual way of connecting nodes. 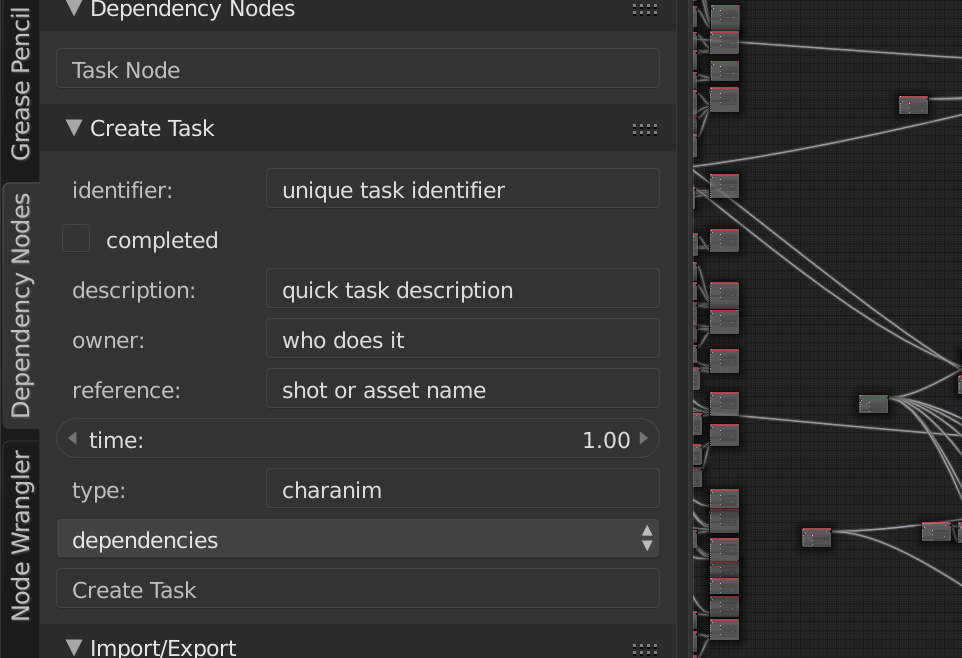 However, we recognized early on that we’d probably need some other connectivity. I created a JSON file format for tasks, and some simple operators to export tasks or import them from JSON files. This helped automate data entry from sources we already had available.
 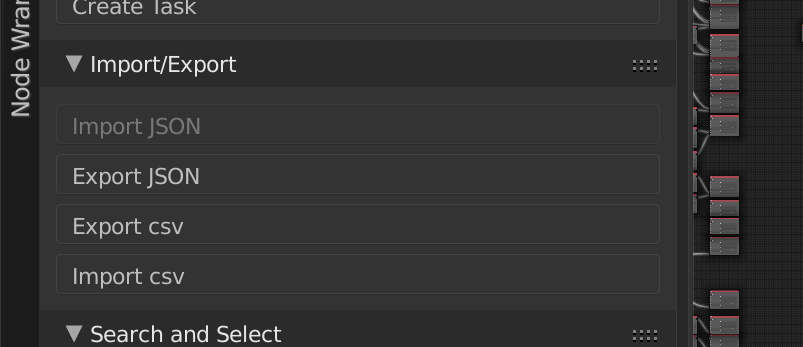 We also know that many people find spreadsheets far more user friendly then nodes – and not everybody has to deal with the dependencies. So we made spreadsheet import and export – currently using .csv files (this could be improved a lot – we aren’t even using csv libraries in python) – but it works fine for our current needs. You can export all or part of the graph to spreadsheet/s, edit those spreadsheets (or create new ones) and then import the changes back into the graph. This makes communicating with the rest of the team fairly simple.
Search
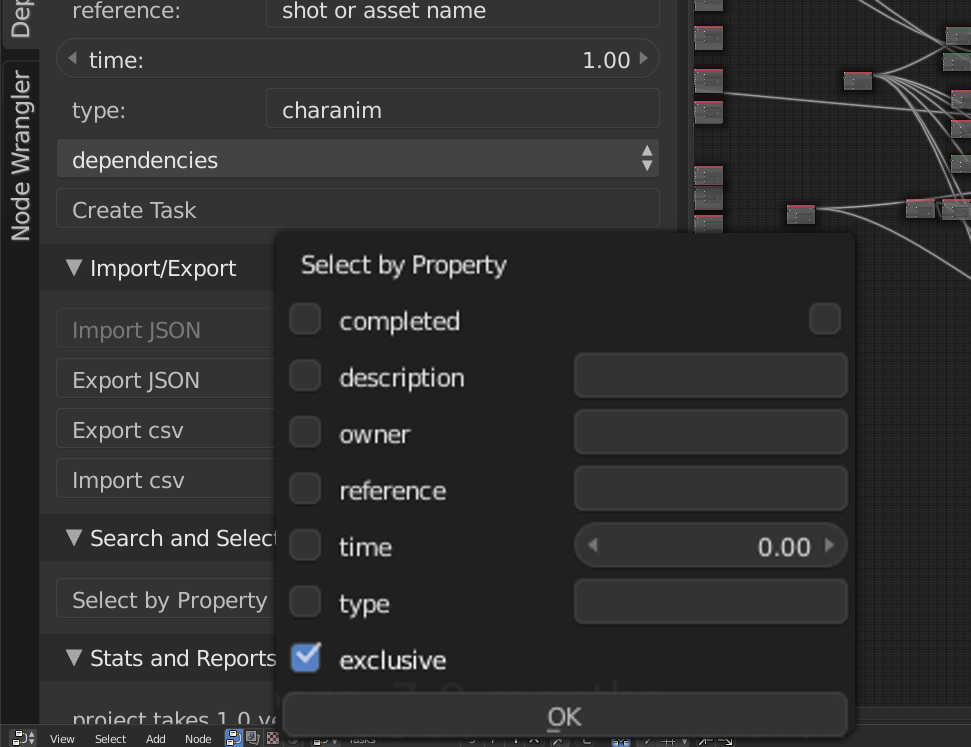 In order to make import and export easy, We have a ‘Search and Select’ function that lets you search for specific things, for instance, you can search for all character animation tasks, and then export a spreadsheet just for those. This is handy to then use for communicating with animators and animation supervisors. We can even modify the spreadsheet – assigning animators, or adjusting estimated time or completion, and then re-import back into the graph. Search is of course, also useful when working directly in the graph, without needing to import or export anything.
Lies, Damn Lies, And Statistics
Finally we have have stats and reports. If Nothing is selected, it adds all the uncompleted task times, giving a total project estimate (in person / time units) Note that our current total is a bit inflated as I tended to pad tasks out – especially tiny ones – things that might take an hour or two have a whole day. This number also assumes only one person working, and no corners being cut. If you have a selection it displays the time for the selected task/s and all its/their dependencies. Thus you only have to select the final render for a specific shot, and see how much time it takes to complete it. 
DNA
While writing this code I wanted to get something ‘up and running’ really fast. At the same time, I feel like this could be more useful in a bigger system. So, to describe the data structure of an individual task, I decided to keep all of this in one really simple class/module, that could then be modified to hook into another library, or to change class types for a given project, etc. without having to touch the rest of the code. While the name is inspired by blender’s sDNA and sRNA systems for data storage and access, this is in no way as elaborate or cool. But it still allows for really quick and nice additions. If you’re looking to take this and integrate into your own system, look at the file taskdna.py first!
 Future Work

In the future I’d like to tie this as a small piece of larger asset/task management systems. That means that there needs to be an api to connect to various project databases, and the taskDNA also needs to be part of that api, allowing the system to define not just the tasks but the actual data structures.
A small part of this that might be cool is enabling image previews in the nodes, reflecting the current status of those tasks.
Download
The current version is zipped and installable via blender’s user preferences->addons panel, get it here: tasker version 0.2
You can also download this project along with a lot of other addons for tube from my gitlab: tube addons project
The files are located in the folder tasker/
Once downloaded either:
- make a zip file of the entire tasker folder then install the zip as an addon in Blender
- if you’re technically inclined, make a symbolic link within the Blender addons directory directly to the tasker/ folder – that way you can git pull it and see the changes directly in blender without having to re-install.
From Politicians to Tasks!
In the import function I wanted to sort the nodes based on the dependencies, so they could be displayed in a nice layout in the editor. DAGs have well known sorting functions, but I didn’t want to implement my own. So, I borrowed code originally written by Paul Tagliamonte for the Sunlight Foundation – It turns out that following the trail of money and influence on politicians is also a DAG, and Paul wrote some beautiful BSD licensed Python for sorting and cycle detection. Thanks Paul!
As a bonus image, here’s the rendered frame produced via the screenshots above:  Finally thanks to everybody here – I hope this post satisfies those of you who, like me, are geeky about this stuff. To them, and everyone else I promise more new cool artwork in the next update!
*The current name is ‘tasker’ but I’m switching to orgnodes as a pun on emacs org mode.
Interestingly enough, open-source cloud offiice suite already exists and should be way less bandwidth-intensive what LibreOffice cloud version is doing. It’s called OnlyOffice.
Interesting! It looks like the community version omits the ‘online editors’ – I wonder what that means